The Numbers Come First
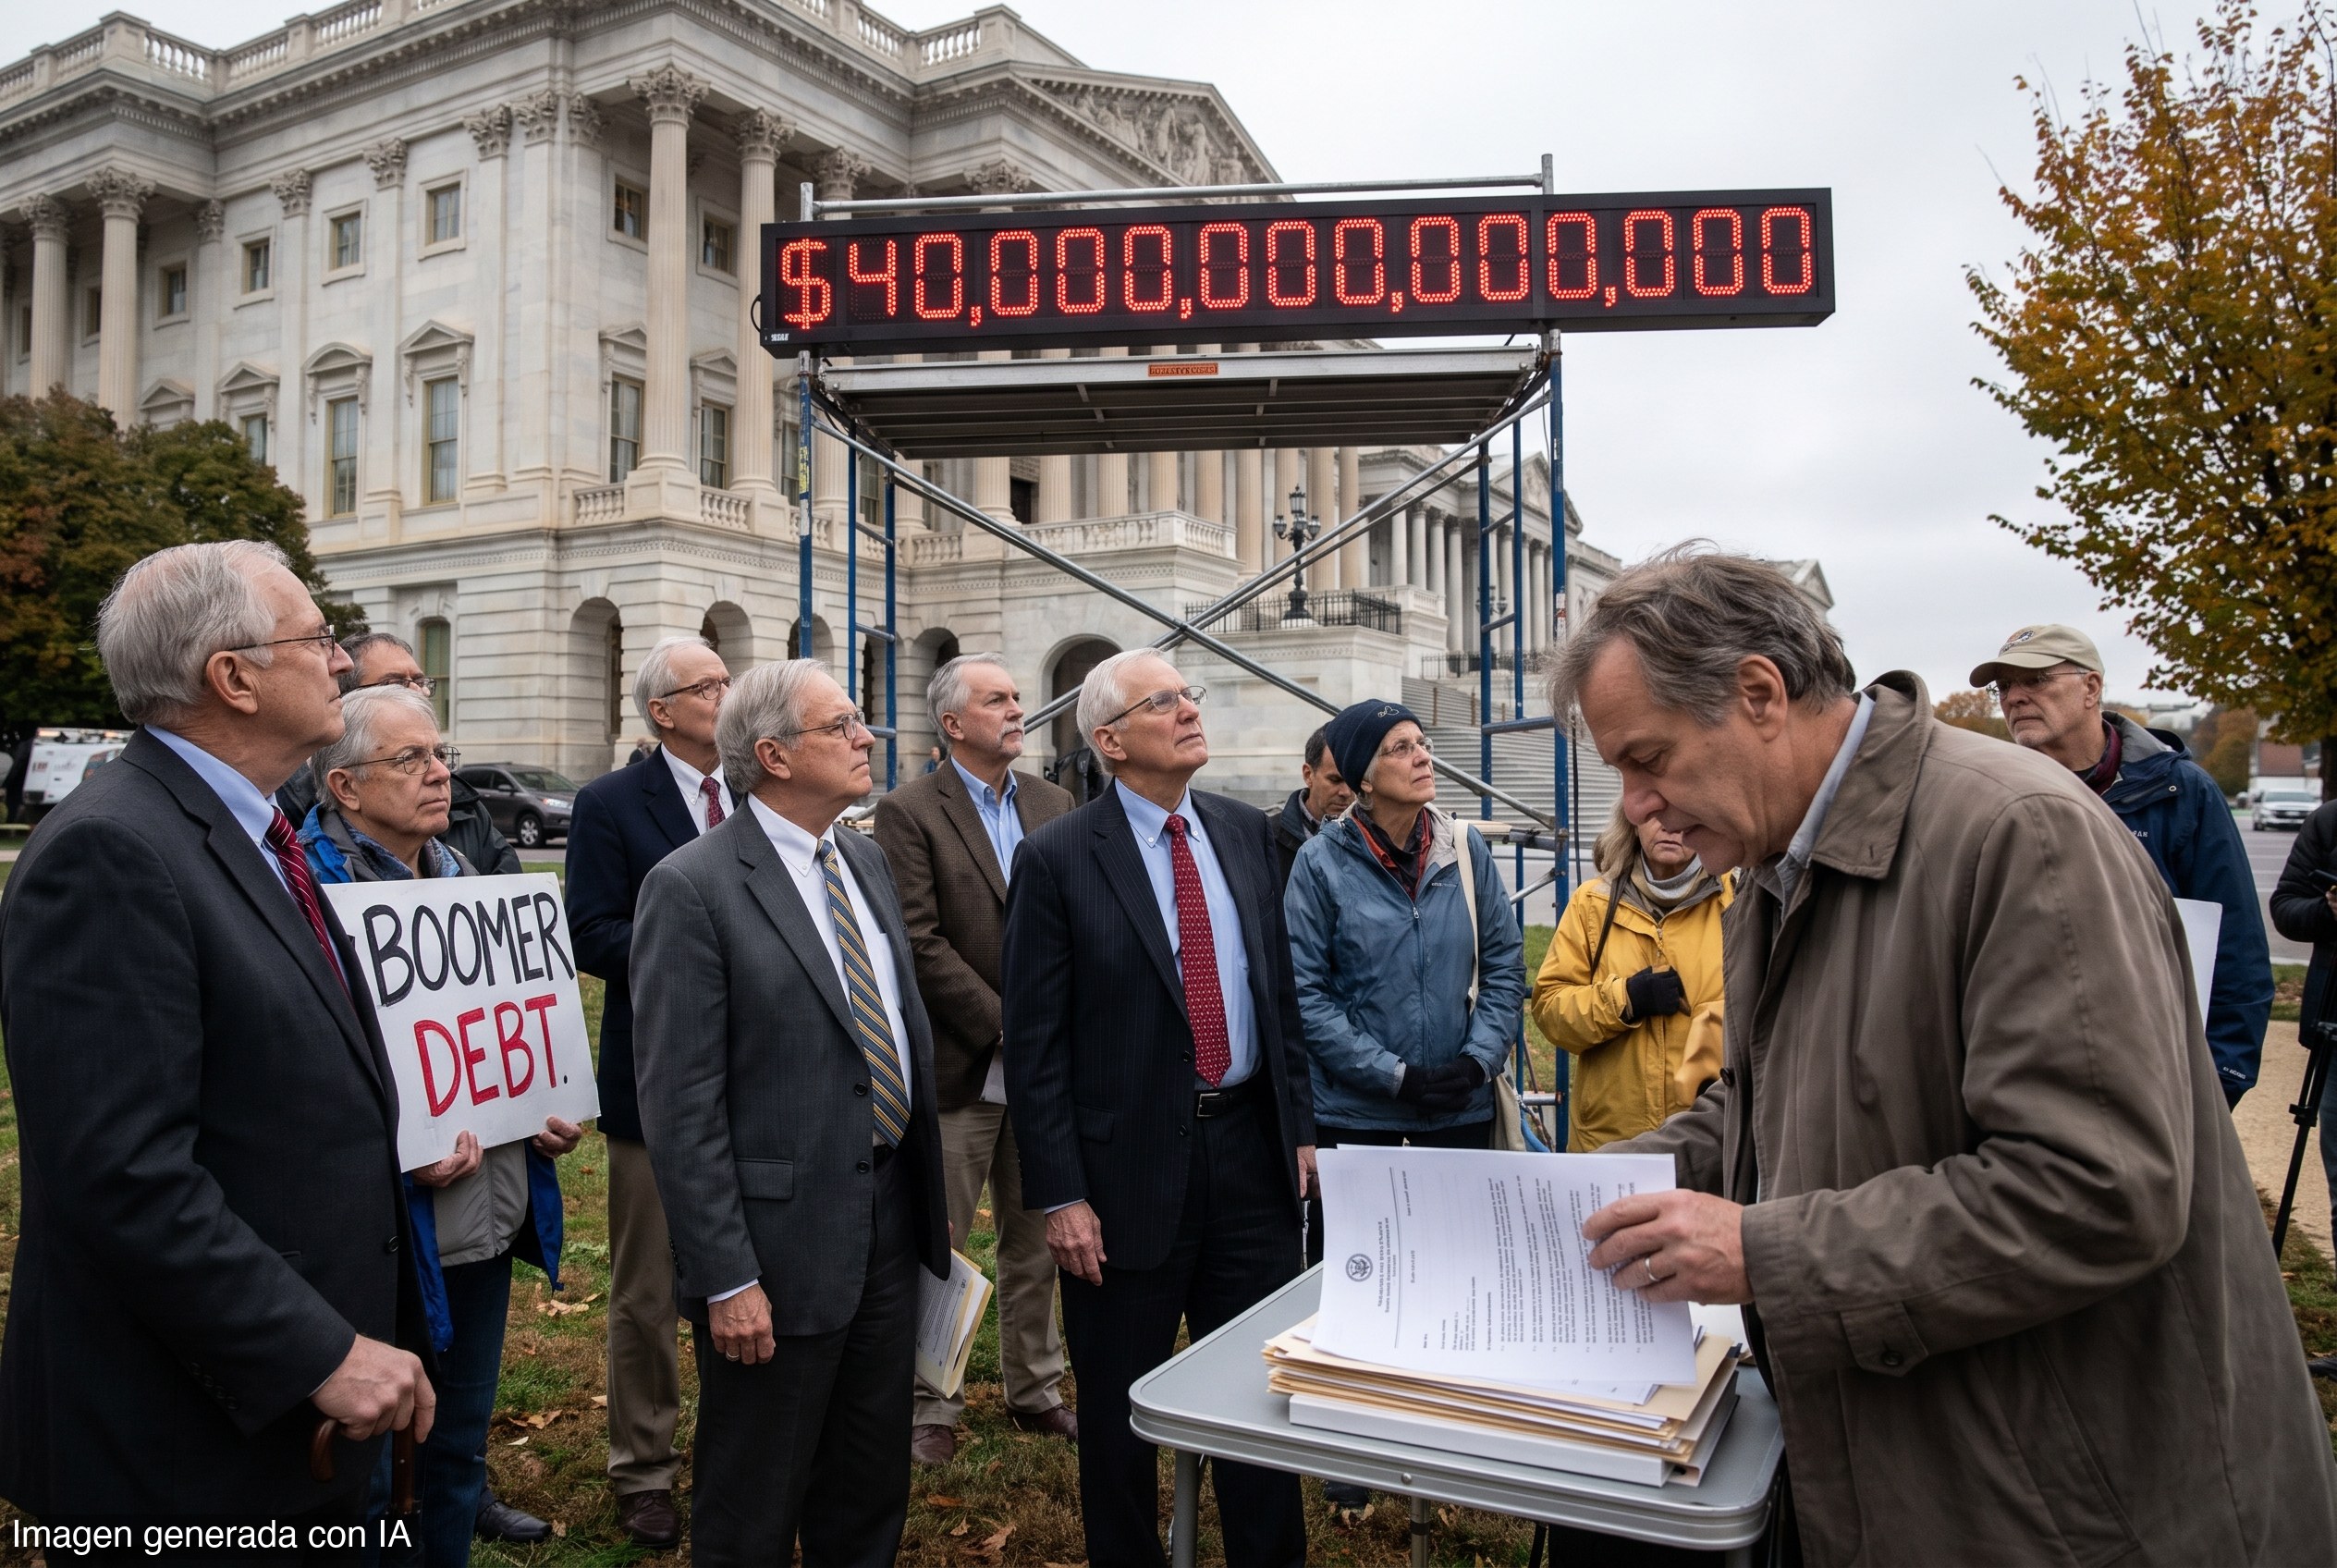
The United States national debt crossed $40 trillion last month. Five months earlier, in March, debt held by the public as a share of GDP hit 100% — a level not seen since just after World War II. The federal government is now running annual deficits of roughly 6% of GDP. In 2001, that same debt-to-GDP ratio stood at 32%, and Washington was posting annual surpluses of 1% to 2%.
The nonpartisan Committee for a Responsible Federal Budget traced the 25-year deterioration to three roughly equal forces: major tax cuts (37% of GDP), spending increases (33%), and recession responses including the 2008 financial crisis and COVID-19 relief (28%). The CRFB's own math is unsparing: strip out any single one of those forces and debt would sit close to its 2001 level. Strip out all three, and the national debt would be paid off today.
Who Signed the Bills
Every major law behind that arithmetic was signed by a boomer president. George W. Bush signed the 2001 and 2003 tax cuts and created Medicare Part D. Barack Obama extended the Bush tax cuts in 2010 and 2013. Donald Trump signed the 2017 Tax Cuts and Jobs Act and, in 2025, the One Big Beautiful Bill Act — which the Congressional Budget Office projects will add $4.7 trillion to the debt through 2035, and potentially more if temporary provisions are made permanent. COVID-19 relief and the 2007–2009 financial crisis response together added more than $6 trillion.
Where the Money Goes
The spending is not age-neutral. The Penn Wharton Budget Model calculates that the federal government spends roughly 10 times more per capita on Americans over 65 than on those under 26. In aggregate, retirees receive 38.6% of all federal outlays — 61.9% of spending assignable to a specific age group — versus 10.3% for the youngest adults.
The Manhattan Institute sharpens the same point: in 2022, Americans 65 and older made up 17% of the population but received 66% of entitlement spending while contributing just 11% of direct tax revenue. A median-wage worker retiring in 2027 will collect roughly $730,000 in lifetime Social Security benefits against less than $200,000 in career contributions — a 265% return once the employer-paid half of payroll taxes is excluded.
The Congressional Budget Office projects that Social Security, health care programs, and net interest costs together will drive 81% of the growth in total federal spending between 2023 and 2033.
The Political Arithmetic
Voters 65 and older make up about 18% of the electorate but cast 25% of votes, according to polling data cited in the Fortune analysis. Medicare protection draws support above 89% among seniors of both parties. Peter G. Peterson Foundation CEO Michael Peterson framed the mechanism directly as the debt crossed $40 trillion: 'We're basically taking $2 trillion from our future.'
CEO Times Read
Free-market readers should resist the temptation to assign blame by generation and focus instead on the structural incentive that produced this outcome: a political system that concentrates benefits on high-turnout constituencies today and defers the cost to workers who have not yet voted — or been born. That is not a boomer problem; it is a design flaw in entitlement architecture that no Congress has had the fiscal courage to correct.
The One Big Beautiful Bill's $4.7 trillion CBO projection is the most immediate data point. Capital markets have so far absorbed the debt load, but 100% debt-to-GDP with 6% annual deficits leaves no margin for the next recession. The taxpayer — specifically the younger one — is the silent creditor of a system that has never asked his permission. The market will eventually price that risk. The question is whether Washington acts before it does.